Financial video library
Get the latest resources on money topics that matter.
What are Mutual Fund Class B Shares?
Tim recently covered what mutual fund A shares are, so if you missed that video, I encourage you to check it out! As noted there, mutual funds have different share classes. It's very important that investors understand these different classes and the potential...
What are Mutual Fund Class A Shares?
Perhaps you've seen that mutual funds have different share classes? Whether or not you've noticed this, it's something you need to be aware of as an investor. Aside from knowing that mutual funds offer different share classes, investors also need to know what these...
Peer and Market Relative Strength
At Mullooly Asset Management, we have two main ways that we measure relative strength. As our friends at Dorsey Wright and Associates have shown us, it's integral to consider a security's peer and market relative strength when determining its place in a momentum...
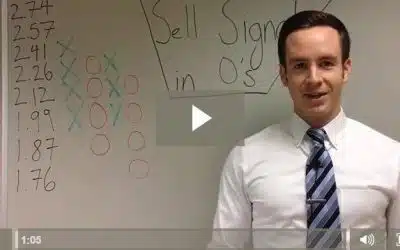
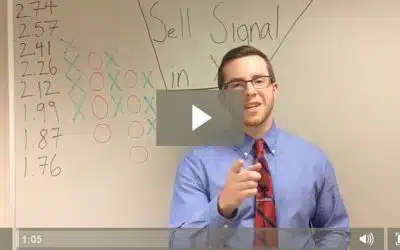
Relative Strength Chart Configurations: Sell Signal in O’s
http://tpmullooly.wistia.com/medias/yoiqiowb1f?embedType=seo&videoFoam=true&videoWidth=838 We've previously discussed the following configurations for point and figure relative strength charts: Buy Signal in X's Buy Signal in O's Sell Signal in X's Today we...
Relative Strength Chart Configurations: Sell Signal in X’s
http://tpmullooly.wistia.com/medias/i1kqutvo6s?embedType=seo&videoFoam=true&videoWidth=838 There's a big difference between a point and figure relative strength chart on a buy signal and one on a sell signal. According to a recent white paper written by John...
Relative Strength Chart Configurations: Buy Signal in O’s
As we discussed on a previous video, the optimal configuration for point and figure relative strength charts is to be on a buy signal and in a column of X's. In this video, Casey continues the discussion on point and figure relative strength chart configurations. What...
Relative Strength Chart Configurations: Buy Signal In X’s
As Tim shared on a previous video, point and figure relative strength charts can be configured in one of four ways. One of these configurations involves being on a buy signal and in a column of X's. What Does This Point and Figure Relative Strength Configuration Tell...
Point and Figure Relative Strength Chart Configurations
Compared to point and figure trend charts, point and figure relative strength charts are much more straightforward. Rather than identifying patterns, like the bearish signal reversal or bullish triangle, we are simply looking for two things: the chart's current column...
What Does the Signal of a Relative Strength Chart Tell Us?
In a previous video, I explained what the column of a point and figure relative strength chart tells us. In this video, I cover what the signal of a point and figure relative strength chart tells us. Both are critical chart components that are not to be overlooked....
Getting Personalized Retirement Account Advice
Individuals are more likely to pay for an oil change than they are for personalized advice on their workplace retirement account. Don't believe it? According to a recent Charles Schwab survey, it's true. Although 87% of those surveyed stated that a 401k was a "crucial...
Thank You for Thirteen Years!
Back in July of 2002, Mullooly Asset Management was founded. At that time, Tom had spent sixteen years as a broker. Our first office was a small 250 square foot space above a store in Avon, New Jersey. As we near the thirteenth anniversary of our founding, we are...
What Does the Column of a Relative Strength Chart Tell Us?
During a previous video, Tim explained that on point and figure relative strength charts, we care less about patterns and more about column and signal. I recently took some time to describe what the column of a point and figure relative strength chart tells us. It's...
How to Interpret a Point and Figure Relative Strength Chart
We've already explained how we calculate relative strength readings for securities and how we plot those readings onto point and figure charts. In this video, Tim explains how to interpret a point and figure relative strength chart. Unlike point and figure trend...
Plotting Relative Strength on a Point and Figure Chart
In this video, I explain how we take relative strength readings and plot them onto a point and figure chart. Point and figure charts are the method we use to organize these readings and interpret their meaning. For a review on how we calculate relative strength...
How We Calculate Relative Strength
Relative strength is an integral part of our portfolio management strategy at Mullooly Asset Management. To put it plainly, relative strength allows us to compare investments. It's our way of sizing up stocks, bonds, mutual funds, ETFs, and even asset classes. We can...
The Bear Trap Pattern
Recently, Tim explained the bull trap pattern. In this video, I describe the opposite of that pattern: the bear trap. Steps of the Bear Trap Pattern - Must form (at least) a triple bottom - additional columns are permitted, but not fewer! - The security breaks below...
The Bull Trap Pattern
On this video, Tim explains a point and figure charting pattern known as the bull trap. Steps of the Bull Trap Pattern - Must form (at least) a triple top - additional columns are permitted, but not fewer! - The security breaks above its top by one box - cannot be...
The Strength of Bullish Support Lines
Support lines tend to act like brick walls. We learned that from our friend and point and figure charting expert Tom Dorsey. This has proven to be true time and time again. On this video, Tom shows the bullish support line's power through an example. Brendan described...
The Strength of Bearish Resistance Lines
What is a bearish resistance line? It's a very important element of any point and figure chart. Bullish support lines and bearish resistance lines help us to identify a security's trend. Knowing whether a potential investment is in a positive or negative trend can...
The Bullish Catapult: A Real Life Example
In this video, Tom shares a real life example of a point and figure pattern known as the bullish catapult. If you haven't already, we recommend checking out Brendan's explanation of the pattern here: https://mullooly.net/what-is-a-bullish-catapult/7972 To review, the...