After the month we’ve experienced here in October 2014, I cannot believe I’m writing that we may see the S&P 500 extend its streak of new monthly all-time highs. Currently (through September 2014) the S&P 500 has reached a new all-time high in 15 straight months! That’s a historically good run.
A few weeks ago if you asked anybody their thoughts on whether that streak would continue or not, they would have laughed at you. Remember on September 15th the S&P 500 reached 2019, but we experienced a near 10% (intraday high to low) correction peak to trough from there. Here we are on the final day of October 2014 threatening to reach another new all-time high on the S&P.
To quote a tweet from Ben Carlson of a Wealth of Common Sense this morning:
It’s OK to be bearish or bullish on the market. Everyone has opinion. But it’s never OK to be certain about what’s going to happen.”
I’ll leave you with a nice chart put together by Ryan Detrick. He shared this on StockTwits this morning and I thought it was interesting. Obviously past results do not guarantee future performance, but it’s always interesting to see what we can learn from history. Here are the S&P 500’s returns on Halloween from the past 20 years.
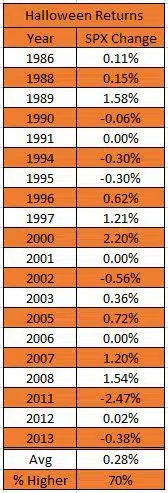
Historical Halloween Returns of the S&P 500 shared by Ryan Detrick on StockTwits: http://stocktwits.com/message/28671071
Sources: