
Last night, I drafted my fantasy baseball team. This can only mean one thing: MLB Opening Day is upon us. One thing I don’t have to worry about, that real baseball managers must consider, is filling out a lineup card. Is it too much pressure to hit the rookie leadoff? Who’s going to bat cleanup? Should the pitcher hit eighth or ninth? These are daily decisions that the manager of a real baseball team has to make.
There are a few simple statistics that can help baseball managers optimize their lineup card:
- On Base Percentage (OBP) – This measures how often a batter reaches base (Times on Base/Plate Appearances).
- Slugging Percentage (SLG) – This measures the number of total bases (Singles + DoublesX2 + TriplesX3 + Home RunsX4)/At Bats) a player hits for, with a focus on extra base hits.
- On Base Plus Slugging (OPS) – This measures the ability of a player to both reach base and hit for power (OBP + SLG).
Generally speaking, managers should look to hit their highest On Base Percentage (OBP) batters first and second. These guys see the most at-bats, and therefore, the most opportunities to get on base and score.
The high Slugging Percentage players hit third, fourth, and fifth because of their ability to hit for extra bases. Extra bases mean a higher probability of driving in runners on base.
The rest of the lineup should be optimized using OPS, with better hitters coming sooner due to the increased number of at-bats they’ll see.
Fortunately for managers, the players in the lineup matter a whole lot more than the order in which they bat. Lineup optimization might only add a few dozen runs to a team’s season total. However, in a sport where wins are valued at a rate of millions in salary, it isn’t something that should be overlooked either.
The situation is very similar for investors. While asset allocation and behavior will be bigger determinants of long term returns, asset location should not be overlooked.
Asset location is your investment plan’s lineup card.
Asset location refers to the way we allocate assets between taxable and tax-advantaged accounts. Different investments and strategies are better served in different types of investment accounts. After-tax returns are what we actually receive from our investments. Knowing this, we should do everything we can to ensure we receive the highest after-tax returns possible.
The following chart highlights which investments are generally best suited for taxable and tax-advantaged accounts. Think of them as our high OBP and SLG hitters. Investors should consult a professional for personalized advice on their situation.
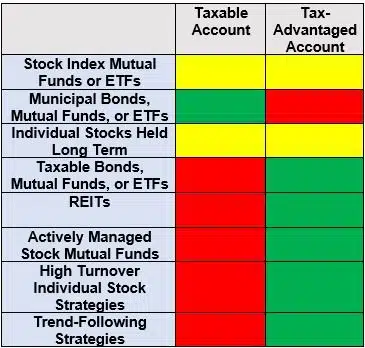
Green = Best, Red = Avoid, Yellow = Fine Either Way
Investments like REITs, taxable bonds, and high turnover investment strategies/funds should be placed in tax-advantaged accounts, if possible. This is because they generate ordinary income through the distribution of interest income or short term capital gains.
Investments like municipal bonds, individual stocks held for the long term, and low-turnover stock index mutual funds and ETFs are better suited for taxable accounts. Municipal bonds should always be held in taxable accounts. However, individual stocks held for the long term and low-turnover stock index mutual funds and ETFs make fine holdings in tax-advantaged accounts too.
An intelligent asset location strategy can help investors achieve a higher after-tax rate of return in the long run. Asset location won’t be as crucial as your asset allocation or your ability to stick with that allocation, but you may be leaving money on the table by not considering it at all. You wouldn’t hit your pitcher cleanup, so don’t overlook the value of asset location within the context of your financial plan.


