• Skip to primary navigation
  • Skip to main content
Mullooly Asset Management, Inc

Mullooly Asset Management

Fiduciary Fee-Only Financial Planner | Investment Advisor in Wall, NJ

  • Services
    • Wealth Management
    • Financial Planning
    • Retirement Planning
    • Investment
    • Estate Planning
  • Our Fees
  • About
  • 732-223-9000
  • Schedule A Meeting

Services

  • Wealth Management
  • Financial Planning
  • Retirement Planning
  • Investment
  • Estate Planning

Quick Links

  • About
  • Our Fees
  • Videos
  • Podcasts
  • Blog

Support

  • Contact
  • Client Login
  • Pay Bill Online
  • Form CRS
  • Our Process
Follow us on Facebook
Follow us on Linkedin
Follow us on Twitter
Watch On Youtube

Let’s talk

How Can You Be So Sure?

January 5, 2016 by Thomas Mullooly

We get asked — often — “how can you be so sure about these charts?  Look at what the market did yesterday!  Are you sure we’re doing the right thing?”

Now, one of our favorite movies is “My Cousin Vinny”  And when we hear these questions, it sounds a lot like the dialogue between Vinny (Joe Pesce) and Mona Lisa Vito (Marisa Tomei):

Vinny: How can you be so sure?
Mona Lisa: If you will look in the manual, you will see that this particular model faucet requires a range of 10-16 foot pounds of torque. I routinely twist the maximum allowable torquage.

One of “the indicators” we employ is a relative strength measurement of the S&P 500 vs the bond market.  Essentially, what this measurement tells us is, “is it better to be in stocks — OR are we better off in bonds?”

Here’s a picture of that chart, courtesy of our friends at Dorsey Wright:

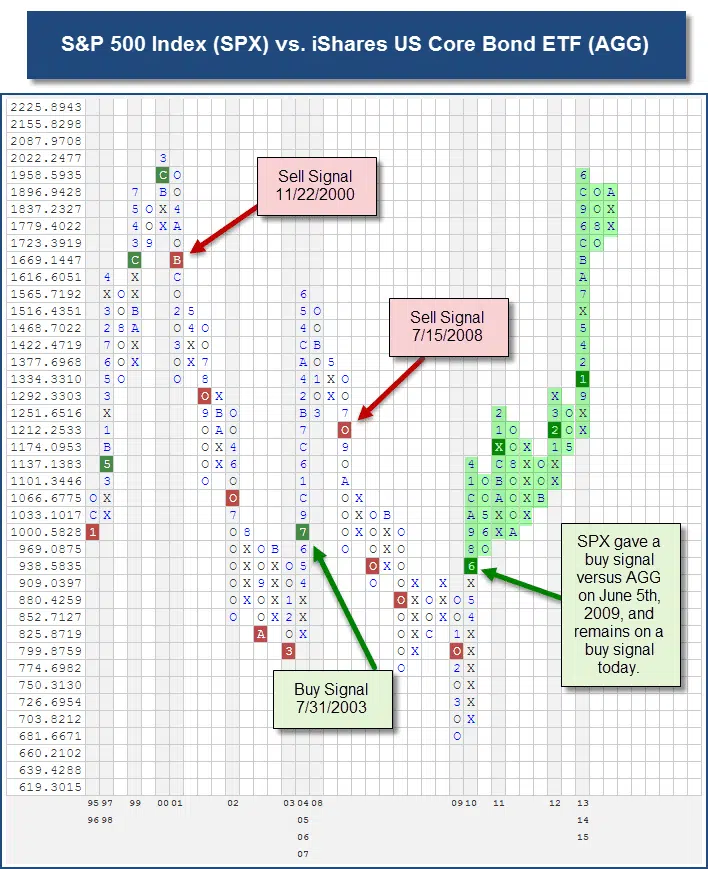
Relative Strength chart of SPX vs AGG, courtesy of Dorsey Wright & Associates

So, what the heck does this mean?
Buy signals on this chart indicate it’s time to over-weight stocks instead of bonds.
And Sell signals indicate it’s time to over-weight bonds, instead of stocks.

This chart gave a sell signal in November 2000.
Then it gave a buy signal (over weight stocks) in summer 2003
It then gave a sell signal in July 2008 (time to under-weight stocks)
The chart then gave a buy signal in June 2009.
It’s been on that buy signal ever since.

Now, this is not the ONLY indicator we use.  It’s one of several indicators.  There will be times when this chart turns from a column of X’s into a column of O’s.  That only tells us that stocks are weak, sloppy, the market is messy — and our phone is going to start to ring.  That is OK.

So when we get days like yesterday (China down 7%, the US markets down a lot) it’s GREAT to have these indicators to fall back on.  It beats relying on the knuckleheads on CNBC, or the articles on Marketwatch.   Headlines on the Marketwatch website yesterday included phrases like “big losses” and “bear market” and “brace for big selloffs.”

Holy cow.

Your New Years Resolution should be to turn off/tune out that noise.  It will feed on your emotions and trick you into making a bad decision.

Never miss a post...and we deliver!

newsletter mailman

Get our updates delivered right to your inbox. Sign up today!

Success! Now go and check your email to confirm your subscription.

There was an error submitting your subscription. Please try again.

We won't send you spam. Unsubscribe at any time. Powered by ConvertKit

Filed Under: Asset Management, News, Point and Figure, Stock Market Comments

About Thomas Mullooly

Thomas Mullooly is owner and founder of Mullooly Asset Management, Inc. In 2002 Tom opened Mullooly Asset Management, a fee-only investment advisory firm. As an investment advisor, and not a broker, Tom works strictly for his clients. With the help of point and figure charting, Tom builds a realistic game plan for clients.

1971 State Route 34, Suite 102
Wall Township, NJ 07719

  • 732-223-9000
732-223-9600
  • support@mullooly.net
  • Services
  • About
  • Our Fees
  • Contact
  • Form CRS
  • Videos
  • Podcasts
  • Blog
  • Client Login
  • Pay Bill Online
  • Our Process

The information on this website and blog do not involve the rendering of personalized investment advice. A professional advisor should be consulted before implementing any of the options presented. None of the content contained in this website should be construed as legal or tax advice. Always consult an attorney or tax professional regarding your specific legal or tax situation.

© 2022 Mullooly Asset Management Inc. All Rights Reserved.

  • Privacy
  • Disclosures and Legal Disclaimers
  • Privacy
  • Disclosures and Legal Disclaimers

© 2022 Mullooly Asset Management Inc. All Rights Reserved.