The Crude Oil chart over the past six months (since August 2014) has been in a free fall. The question now, is the crude oil chart merely glancing off the third floor awning (on the way to a splat on the sidewalk)? Or is crude oil forming a base that might become a new floor?
This point and figure chart is provided courtesy of Dorsey Wright & Associates.
Is the Crude Oil chart compelling, actionable, or objectionable?
In our view, here are some positives:
1. The crude oil chart appears to have (temporarily) stopped moving down.
2. The current location is in the middle of the ten-week trading band.
3. If crude oil can remain above $49, this would indicate rising bottoms. This is a sign supply (selling) is drying up.
4. The oversold condition has been worked off.
5. A move up to $54 would form a spread triple top.
And, in our view, here are some negatives:
1. Crude Oil remains in a negative trend. Bad things happen in negative trends.
2. Resistance for the crude oil chart is in the $70’s, FAR above the current price.
3. The asset group has negative relative strength versus the market.
4. Crude Oil (and commodities in general) is not a favored investment class.
Our Analysis (but not a recommendation!)
Gamblers line up: there is a TON of risk at the current time in crude oil. A rise in the price from here would be a source for speculation. A fall in the price of crude oil from here would be a resumption of the downward trend which is already solidly in place. Make no mistake, this chart is currently in a severe downward trend, this is NOT a place for conservative investors!
It is possible to make money in charts like this crude oil chart. But the odds are stacked against us currently. Risk!
A better outcome for this crude oil chart would be to see continued basing around these levels. Over time, simply “treading in place” and creating more column changes (more columns of X’s and O’s) would drag the overhead resistance line down much closer to the current price. What that does is put the price closer to moving into a positive trend. In a positive trend, we have improved chances for better (positive) outcomes.
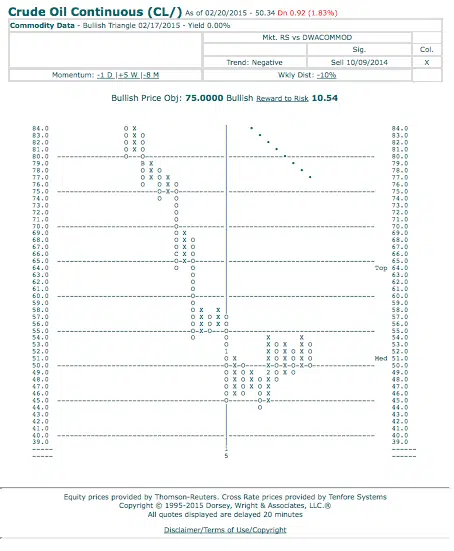
Crude Oil Chart 2015_02_20 Courtesy Dorsey Wright & Associates, as analyzed by Mullooly Asset Management, Inc.


